Background
Every year in July, I tabulate statistics for treatments performed by the Preservation Unit and for materials sent to the commercial bindery for the fiscal year that ends in June. The FY20 numbers were calculated in July, but only as numbers in a spreadsheet. I participated in a tutorial earlier this year on Tableau, a data visualization software, and the prospect of displaying our data interactively appealed to me. (Thanks to Lora Lennertz, Data Services librarian, for hosting the tutorial.) Recently I dove back in to the program to transform our FY20 treatment data.
Before getting to the visualizations though, a little background on our unit record keeping. After Lindsey Williams, Preservation and Binding Specialist, started in April 2019, our treatment tracking moved from being paper-based to being computer-based. Lindsey created an incoming projects register in Excel, which we’ve refined as needed over time. In spreadsheet format, we can easily track a lot more detail, which is really important! The paper form didn’t catch certain information (such as which division the work was for); also, there’s repair work happening now that previously wasn’t, so that obviously needs to be recorded. Down the road, there will likely be more changes–for example, we could add a “Material Type” column so we can look at numbers on different materials (so far we’re treating mostly paper and books, but this would be good to track and see how it changes over time).
Here’s a glance at what we’re recording:

Date, Dept., Call #, Title, Issue/Problem, Type, Solution, Date Returned, Initials, Notes
The record keeping for materials shipped to the commercial bindery hasn’t changed. It’s in Excel too, and breaks down the number of items sent for binding by type (e.g., serials, monographs, music books), along with invoice amounts.
Our Libraries closed in March this year due to the COVID-19 pandemic, which meant hands-on treatments and bindery shipments were put on hold until the end of August as part of the phased re-opening. While FY20 isn’t a reflection of a typical year since three and a half months of work couldn’t be done (it’s fair to say we’ve learned there’s really no such thing as “typical” anymore), there was still a fair amount accomplished.
Visualizations
The Preservation Unit is in the Technical Services department, and we work with everyone in the Libraries to handle their treatment and/or binding-related needs. Our projects register tracks materials by Department. These include:
- Arkansas Collection (part of Special Collections)
- Chemistry
- Fine Arts Library
- Government Documents
- Learning Resource Center
- LINX (high-density storage)
- Main (Mullins Library)
- Math
- Physics
- Rare (part of Special Collections)
- Reference
- Special Collections
For the visualizations, it made the most sense to aggregate the Departments into Divisions. This gives us total numbers of work performed for these larger groups. Divisions are comprised of these Departments:
- Main: Government Documents, Learning Resource Center, LINX, Reference
- Branch: Fine Arts, Chemistry, Physics, Math
- Special Collections: Arkansas Collection, Rare, and everything else in Special Collections
Now, on to the data.
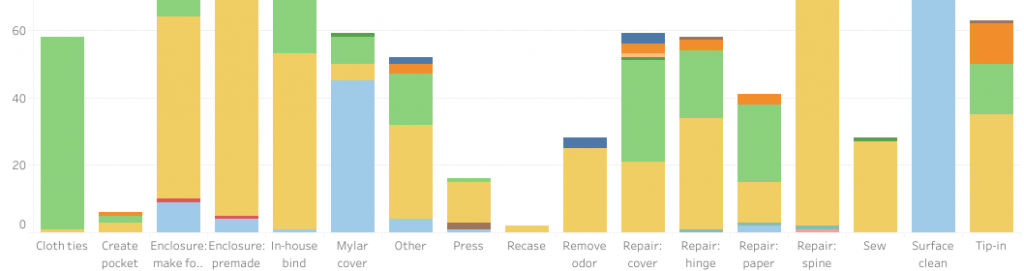
Treatment by type
FY20 recorded 1,346 treatments to Libraries materials – a 53% increase over FY19. Treatments performed are color coded by the total count of each one. The high count for surface cleaning is due to the Porter-Pathfinder Collection making its way to Special Collections; the books were in boxes for years, and needed vacuuming and brushing. The lowest count is for recasing, but this will likely increase in the future.

Here’s a breakdown of treatments performed by month (not in FY order from July to June, and a few treatments didn’t have a month associated with them so are represented as “Null”).
With any of the Tableau charts, if you hover your mouse over different colors/sections you’ll see a count associated with it.

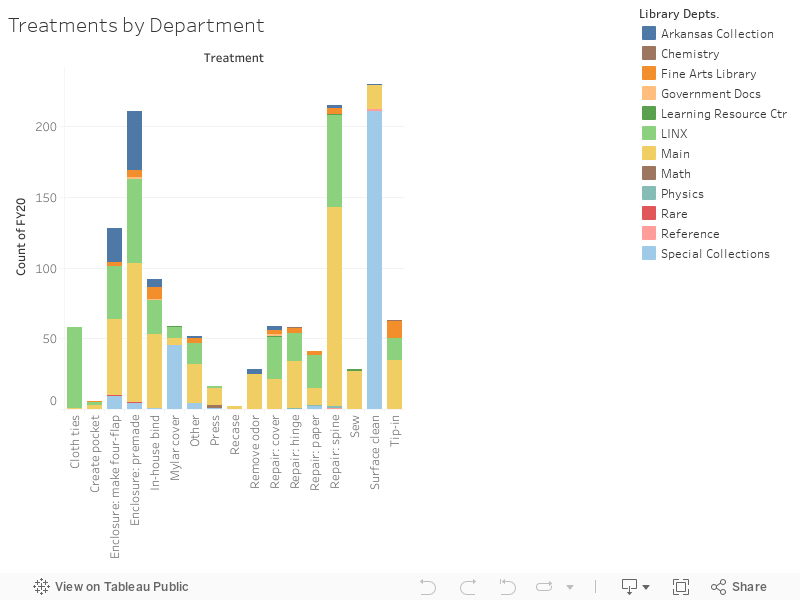
Departments
The same treatments are shown here by Department.
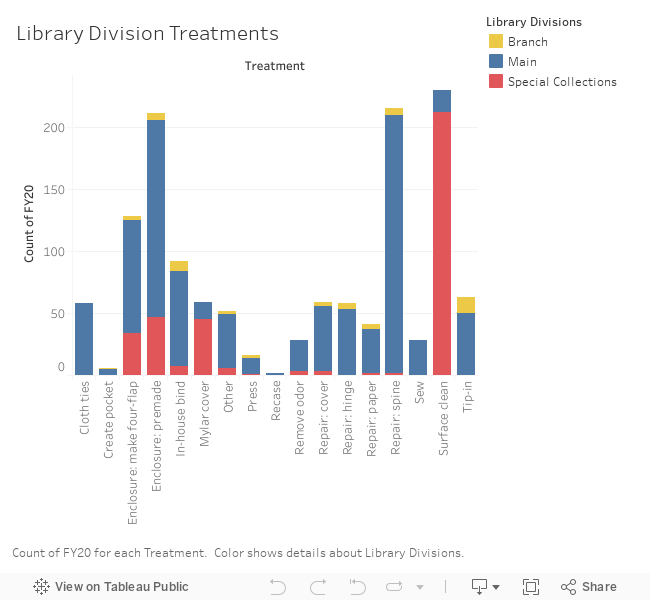
Divisions
Here, treatments are broken into library Divisions, and are shown in descending order by count. This makes it easy to see what work was most frequently done, and how the needs differed by Division. Not all treatment types were needed in each Division. For example, 58 cloth ties were needed in Main, but none in the Branches or Special Collections.

With aggregated counts, a clearer picture emerges of which Division had the highest number of treatments (SPOILER ALERT: MAIN WINS).
I’m sure there’s a way in Tableau to show percentages instead of totals, and I’ll figure it out soon after publishing this. 😉 Until then, here’s the breakdown of Division by percent of total treatments performed in FY20:
- 69% – Main
- 26% – Special Collections
- 3% – Branches
And here are the totals.

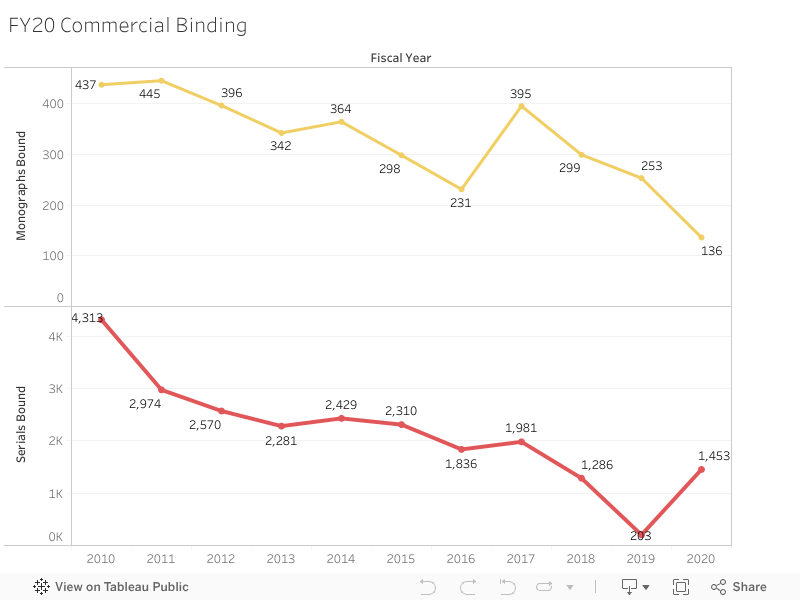
Commercial Binding
Finally, here’s a look at counts for commercial binding over the last decade. We send monographs and serials to the bindery. The decline in numbers for serials reflects the decrease in print journal subscriptions; the spike in FY20 is due to a large number of dropped titles. The monographs bound in FY2020 include 92 that were bound in-house on our Fastback binding machine; while it’s not technically commercial binding, it binds using glue (perfect binding, which the commercial bindery also uses in some instances) and not hand sewing. Monograph numbers will continue to be low as we have the training and capability to repair books.
Nerding out
Because we record the call numbers for items we treat, I started wondering what call number classes and subclasses received the highest number of treatments? Is there any correlation to the use of the collection by patrons? I knew the first question could be answered through Tableau, so let’s take a look.
First, I worked with the call number information in Excel to separate the class and subclass information from the rest of the number, since we record the entire number. Next, I ran subtotals in Excel for the total treatments by call number class. Then, I made new sheets for the top three call numbers so I could run a treatment breakdown for those specific ones.
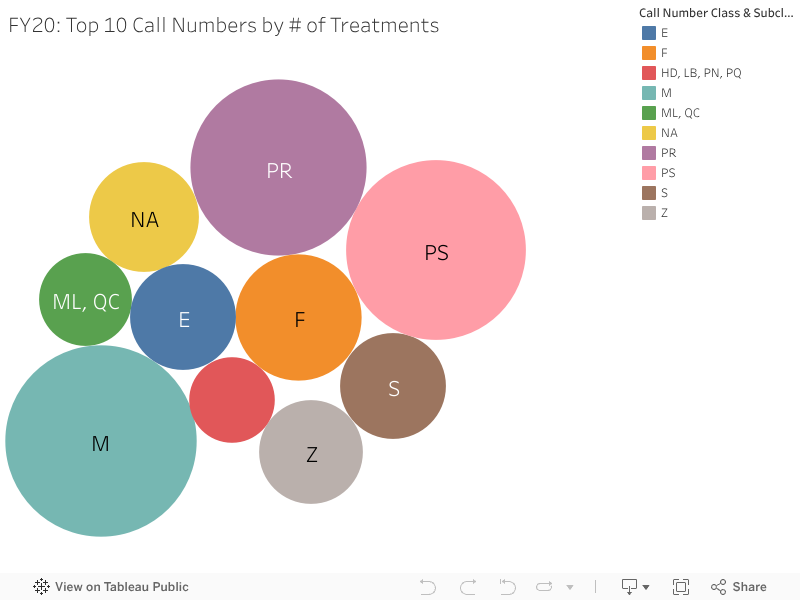
From the Top 10 list, we can see where within the collections the majority of treatments happened: M, PS, and PR are the top three. A few call numbers had the same total treatments, so they’re grouped together as a single number within the Top 10.

Here’s a fun way of visualizing the same Top 10 list!
This is about to get really nerdy here with breakdowns of treatment types for the Top 3 call numbers.
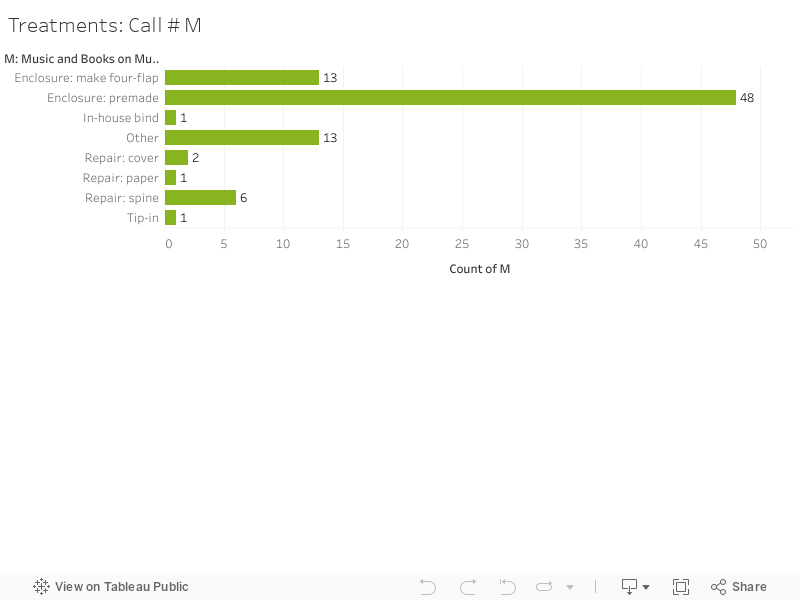
#1 is M (Music and Books on Music) at 85 treatments
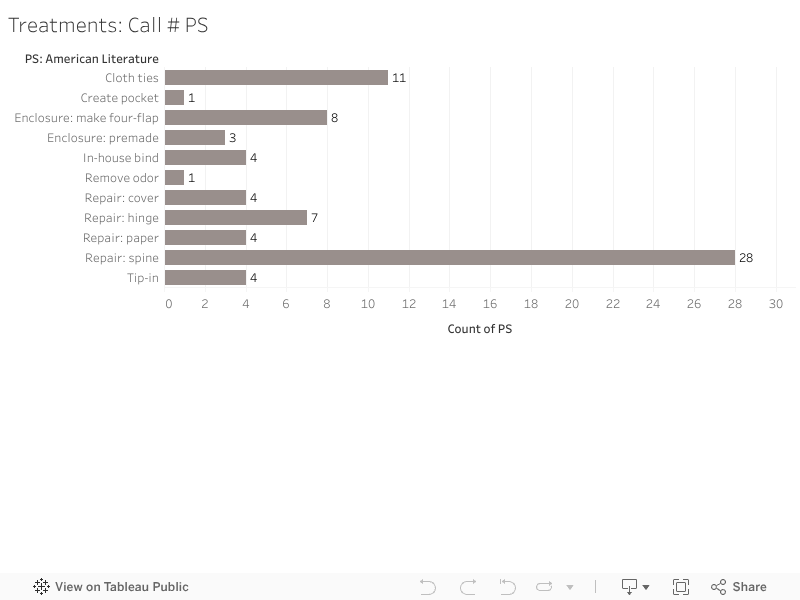
#2 is PS (American Literature) with 75 treatments
#3 is PR (English Literature) with 72 treatments
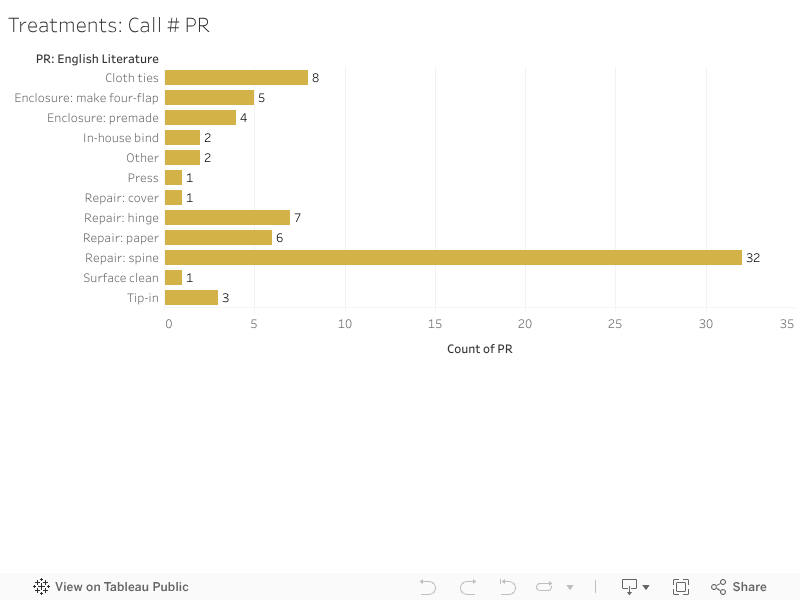
The enclosures for M were pamphlet binders that music scores were sewn into. We may revisit this categorization – should it be recorded as a premade enclosure or as sewing? No surprise that spine repair was the top treatment for PS and PR – lots of handling (poor or otherwise) can lead to spine damage. This was a fun look into the data that would’ve been much more complicated without Tableau!
Other accomplishments
Not everything we do can be easily quantified. Here are other unit accomplishments during FY20:
- Microfilm testing in Main and Special Collections, with a report on findings
- Completed spreadsheet tracking Library preservation within SEC universities and peer institutions
- Coordinated training and discussion on box making with Preservation, two Special collections staff members, and the University Museum curators
- Presented on paper and photographs at the half-day Preserve Your Past workshop held with the University Museum
- Finalized workflows between Preservation and each of the following units: Circulation, ILL, LINX, and Special Collections
- Published updated Preservation StaffGuide
- Completed online courses including Introduction to Mold & Pests, Gawain Weaver’s Care and Identification of Photographs, and the Getty’s Modular Cleaning Program for conservation of materials
- Participated in monthly meetings of Special Collections Cataloging and Preservation group
- Investigated opportunities within the Libraries for writing an NEH Preservation Assistance Grant
- Participated in numerous webinars on preservation and conservation topics while working from home starting in March
We also want to acknowledge the student workers who were a huge help with reviewing duplicate journals, handling discards, processing returned bindery shipments, and other miscellaneous tasks. Thank you, Justin and Tiffany! And thank you to the Serials Unit for generously sharing student worker hours with us.
Until next year (and new numbers even more impacted by the changes to our functionality due to COVID-19), we’ll keep counting.